



Global supply chain pressures eased in July as manufacturers reduced precautionary stockpiling and transportation costs moderated, but persistent material shortages and growing production backlogs left supply chains exposed to renewed geopolitical disruption, according to the GEP Global Supply Chain Volatility Index.
- Key July 2026 Findings
- Global Supply Chain Pressures Ease in July
- Material Shortages Keep Supply Chains Vulnerable
- Manufacturing Demand Slows as Stockpiling Fades
- Key Regional Findings July 2026
- European Procurement Activity Remains Subdued
- Supply Chains Face Renewed Geopolitical Disruption
- What is the GEP Global Supply Chain Volatility Index?
Key July 2026 Findings
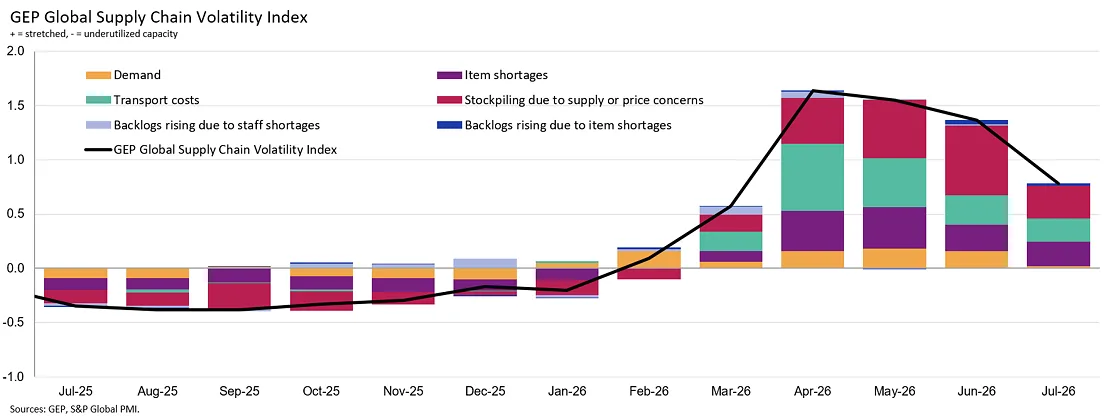
- DEMAND: July data indicated a slowdown in factory purchasing volumes. The index’s demand component was its weakest in the year-to-date, driven principally by China and, to a lesser extent, the U.S. The data suggest that the stockpiling-driven boost to demand has faded at the start of the third quarter.
- INVENTORIES: Reports of global manufacturers stockpiling raw materials and intermediate products due to price or supply concerns fell for the first time since January, indicating that procurement leaders ran down the inventories they had built up since the Middle East war began.
- MATERIAL SHORTAGES: The items in short supply indicator fell only fractionally in July, indicating a limited improvement in the availability of critical manufacturing inputs. Overall, supply shortages remained high by historical standards.
- LABOUR SHORTAGES: Manufacturers’ reports of backlogs rising due to staff shortages remained anchored, signalling that labour was not a hindrance to capacity utilisation during July.
- TRANSPORTATION: The global transportation cost indicator fell again in July, reaching its lowest level since March. That said, data were principally collected prior to global oil prices surging towards the tail-end of the month.
Global Supply Chain Pressures Ease in July
Global supply chain conditions improved during July as manufacturers reduced safety-stock building and demand for intermediate goods and raw materials stagnated.
The GEP Global Supply Chain Volatility Index, produced by S&P Global and GEP, tracks demand, shortages, transportation costs, inventories and backlogs using survey data from around 27,000 businesses across more than 40 countries.
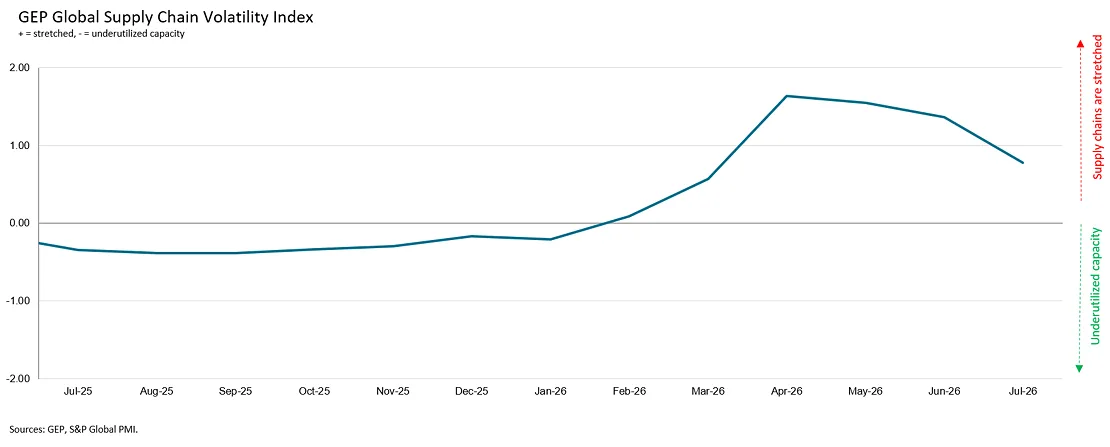
Manufacturers scaled back precautionary inventory building following a three-and-a-half-year peak during Q2 2026. Reports of manufacturers stockpiling raw materials and intermediate products because of price or supply concerns fell for the first time since January.
Transportation costs also declined, with the global indicator reaching its lowest level since March.
However, most survey responses were collected before renewed disruption to shipping through the Strait of Hormuz and the latest escalation in the Middle East.
Material Shortages Keep Supply Chains Vulnerable
Despite the overall easing in supply chain pressures, shortages of critical manufacturing inputs remained high by historical standards.
The index’s indicator for items in short supply fell only fractionally during July, while manufacturers continued to report increasing production backlogs caused by unavailable materials and components.
The findings indicate that supply bottlenecks remained unresolved ahead of the latest geopolitical disruption.
Labour constraints were less significant, with reports of backlogs caused by staff shortages remaining stable during July.
Manufacturing Demand Slows as Stockpiling Fades
Factory purchasing volumes also weakened, with the index’s demand component recording its lowest reading of 2026 to date.
The slowdown was driven principally by China and, to a lesser extent, the US, indicating that the boost to procurement activity created by previous stockpiling had faded at the beginning of Q3.
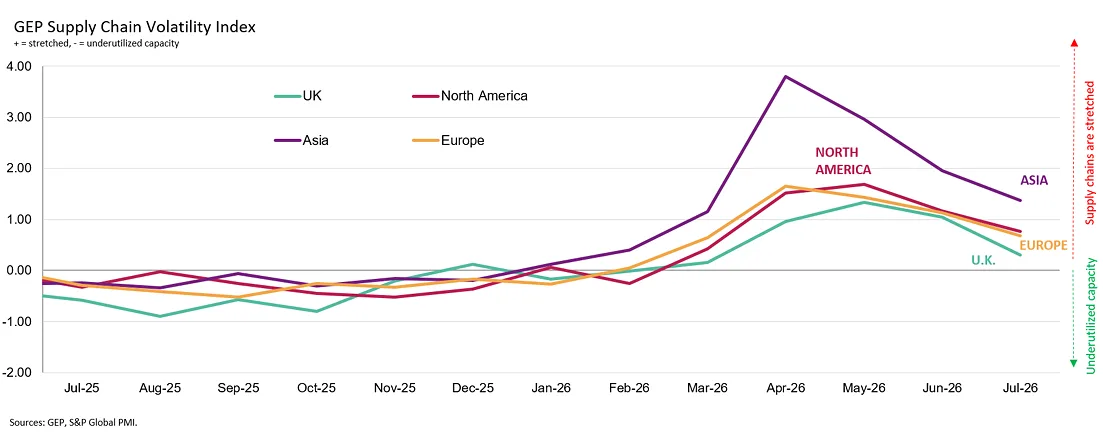
Asia nevertheless remained the strongest region for manufacturing demand. Its index declined from 1.95 in June to 1.37 in July, its lowest reading since March.
North America’s index fell from 1.17 to 0.76, signalling a further easing in pressure on manufacturing supply chains.
Key Regional Findings July 2026
- ASIA: Index decreased to 1.37, from 1.95, its lowest reading since March. Asian factory purchasing activity slowed sharply in July, driven by China.
- NORTH AMERICA: Index fell to 0.76, from 1.17, pointing to a further easing of supply chain pressures faced by North American manufacturers.
- EUROPE: Index declines to 0.68, from 1.13, its lowest level since March. Demand for manufacturing inputs shrank further, indicating factory retrenchment across the continent.
- U.K.: Sharp reduction in the index to 0.30, from 1.05 as U.K. manufacturers rapidly reduced their procurement activity and ran down their stocks aggressively.
European Procurement Activity Remains Subdued
Europe’s index declined from 1.13 to 0.68, also reaching its lowest level since March. Demand for manufacturing inputs contracted further as factory order books and inventory building remained comparatively weak.
The UK recorded an even sharper decline, with its index falling from 1.05 to 0.30.
According to the data, UK manufacturers rapidly reduced procurement activity and aggressively ran down inventories during July.
Despite the regional declines, all four indices remained above zero. Under the GEP index methodology, readings above zero indicate that supply chain capacity is being stretched, with higher readings representing greater pressure on capacity.
Supply Chains Face Renewed Geopolitical Disruption
The July findings provide a snapshot of global supply chain conditions immediately before renewed disruption in the Strait of Hormuz and an increase in energy prices and geopolitical uncertainty.
While reduced stockpiling and lower transportation costs contributed to an easing of overall pressures, elevated material shortages and production backlogs indicate manufacturers remained exposed to further disruption.
What is the GEP Global Supply Chain Volatility Index?
The GEP Global Supply Chain Volatility Index is produced by S&P Global and GEP. It is derived from S&P Global’s PMI® surveys, sent to companies in over 40 countries, totalling around 27,000 companies. The headline figure is a weighted sum of six sub-indices derived from PMI data, PMI Comments Trackers and PMI Commodity Price & Supply Indicators compiled by S&P Global.
- A value above 0 indicates that supply chain capacity is being stretched and supply chain volatility is increasing. The further above 0, the greater the extent to which capacity is being stretched.
- A value below 0 indicates that supply chain capacity is being underutilised, reducing supply chain volatility. The further below 0, the greater the extent to which capacity is being underutilised.
This article was produced by the editorial team at North America Outlook and published as part of the Outlook Publishing global network of B2B industry magazines.
Outlook Publishing delivers industry insights, company stories, and sector coverage across manufacturing, mining, construction, healthcare, supply chains, food production, and sustainability.
North America Outlook provides ongoing coverage of organisations and developments shaping industries across North America.